Optical rotation is a unique property of polarization in certain materials. Specific rotation refers to how much the plane of polarization rotates in solutions. By measuring the total optical rotation of a sucrose solution at various concentrations, one can make a linear fit to find the specific rotation of sucrose. It was found that sucrose has a specific rotation of , with the high uncertainty in the final measurement likely due systematic error.
PACS numbers: 42.25.Ja, 42.25.Lc, 42.79.Ci
Background
The study of light dates back towards the beginning of recorded history, with the ancient Greek thinker Euclid publishing his principles on the motion of light in Optica in 300 BC \cite{Gabo}. Much more has been learned since then, including that light exhibits wave characteristics as well as particle characteristics. This wave-particle duality was explored by Christiaan Huygens in the 1670’s, partially through the discovery of polarization in calcite \cite{Gabo}.
Electromagnetic waves normally oscillate in any number of planes orthogonal to the direction of propagation. This unpolarized light is what is emitted by most sources. Certain polarizing materials can confine the oscillation to one specific plane, as seen in FIG. \ref{polar}. In 1808 the French scientist Etienne Louis Malus formulated the equations that describe the intensity of transmitted polarized light as a function of polarization angle, seen in equation \ref{Malus}:
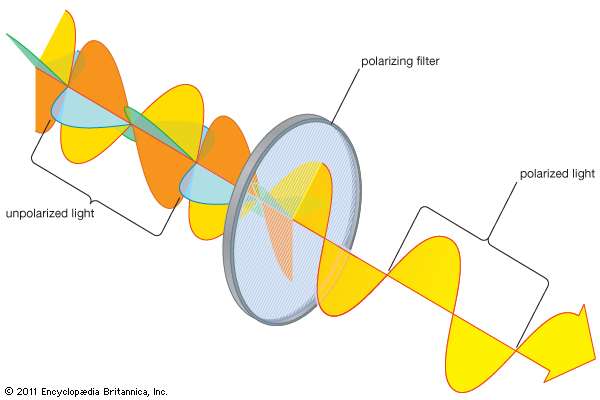 Polarization of electromagnetic waves. Unpolarized light oscillates in many planes (left side), while light that has been polarized oscillates only in the plane of polarization (right side).
Typically this polarization is achieved artificially with manufactured polarizing filters, however polarization also occurs naturally, and often with unusual effects.
Certain materials can vary the way they alter the polarization of incident light depending on the orientation of the material to the light. These materials are known as birefringent and obtain their unusual abilities from their molecular structure \cite{Vogel}. Birefringent materials have a different index of refraction depending on the polarization of light–the amount the light bends is dependent on the polarization (FIG. \ref{biref}). There is a subset within birefringent materials that not only change the direction of light, but also the plane of polarization. This phenomenon is called optical activity or optical rotation and is the key to our measurement.
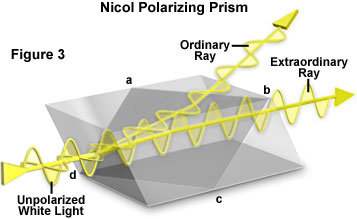 An example of a birefringent crystal. Light in one plane of polarization does experiences more refraction than that of an orthogonal plane of polarization.
Optical activity only occurs in chiral materials–materials that lack any form of mirror symmetry (FIG \ref{chiral}). This effect was first recorded in 1811 in quartz \cite{Gabo}, but can also be observed in sucrose, another chiral material. The amount the polarizing plane is rotated in optically active materials depends on the path length through the material and, in fluidic solutions, the concentration of the chiral material. This optical rotation can be calculated for a solution by using the Drude Model:
This equation solves for the specific rotation of a concentration solution for a given temperature T and a given wavelength of light . The total optical rotation is often what’s measured in order to find the specific rotation. The remaining two variables, and c, represent the path length of the light through the solution, measured in decimeters, and the concentration of chiral material in the solution, measured in .
If we rearrange this equation to isolate as the slope of a line, we get:
Where is our independent variable and the total optical rotation is the change in observed polarization.
We can utilize the properties of polarization to learn about the chirality of sucrose. By shining monochromatic light through a sample of our solution and measuring the optical activity we can obtain an equation for the total optical rotation of our solution, from which we can extract a linear fit for the specific rotation.
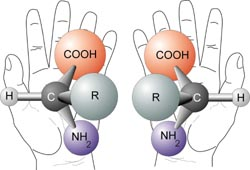 A visualization of chirality. If you cannot superimpose the mirror images onto each other, the element is chiral.
Approach
Our approach was based off an experiment described by Patterson et al. \cite{Patterson} in 2015. However, unlike the aforementioned experiment we did not have access to a polarimeter so we utilized two linear polarizing filters to measure the optical rotation of our sucrose solution.
Normally two polarizing filters offset by 90° will perfectly block light transmission:
However, the introduction of a third polarizing element in between the two will rotate the polarization plane and actually increase the amount of light transmitted when the two filters are offset 90°. Since the sucrose changes the plane of polarization, it will change the angle at which light hits the second polarizer. By measuring the new angle at which the second polarizer blocks all incident light, we can determine how much the sucrose solution has rotated the polarizing plane.
We prepared five different sucrose solutions at the various concentrations, 5%, 10%, 15%, 20%, and 25% by mass. The scale we were using did not have the desired level of accuracy, so we calculated the density of our entire supply of sucrose and measured it out by volume instead, since we could obtain more accuracy that way.
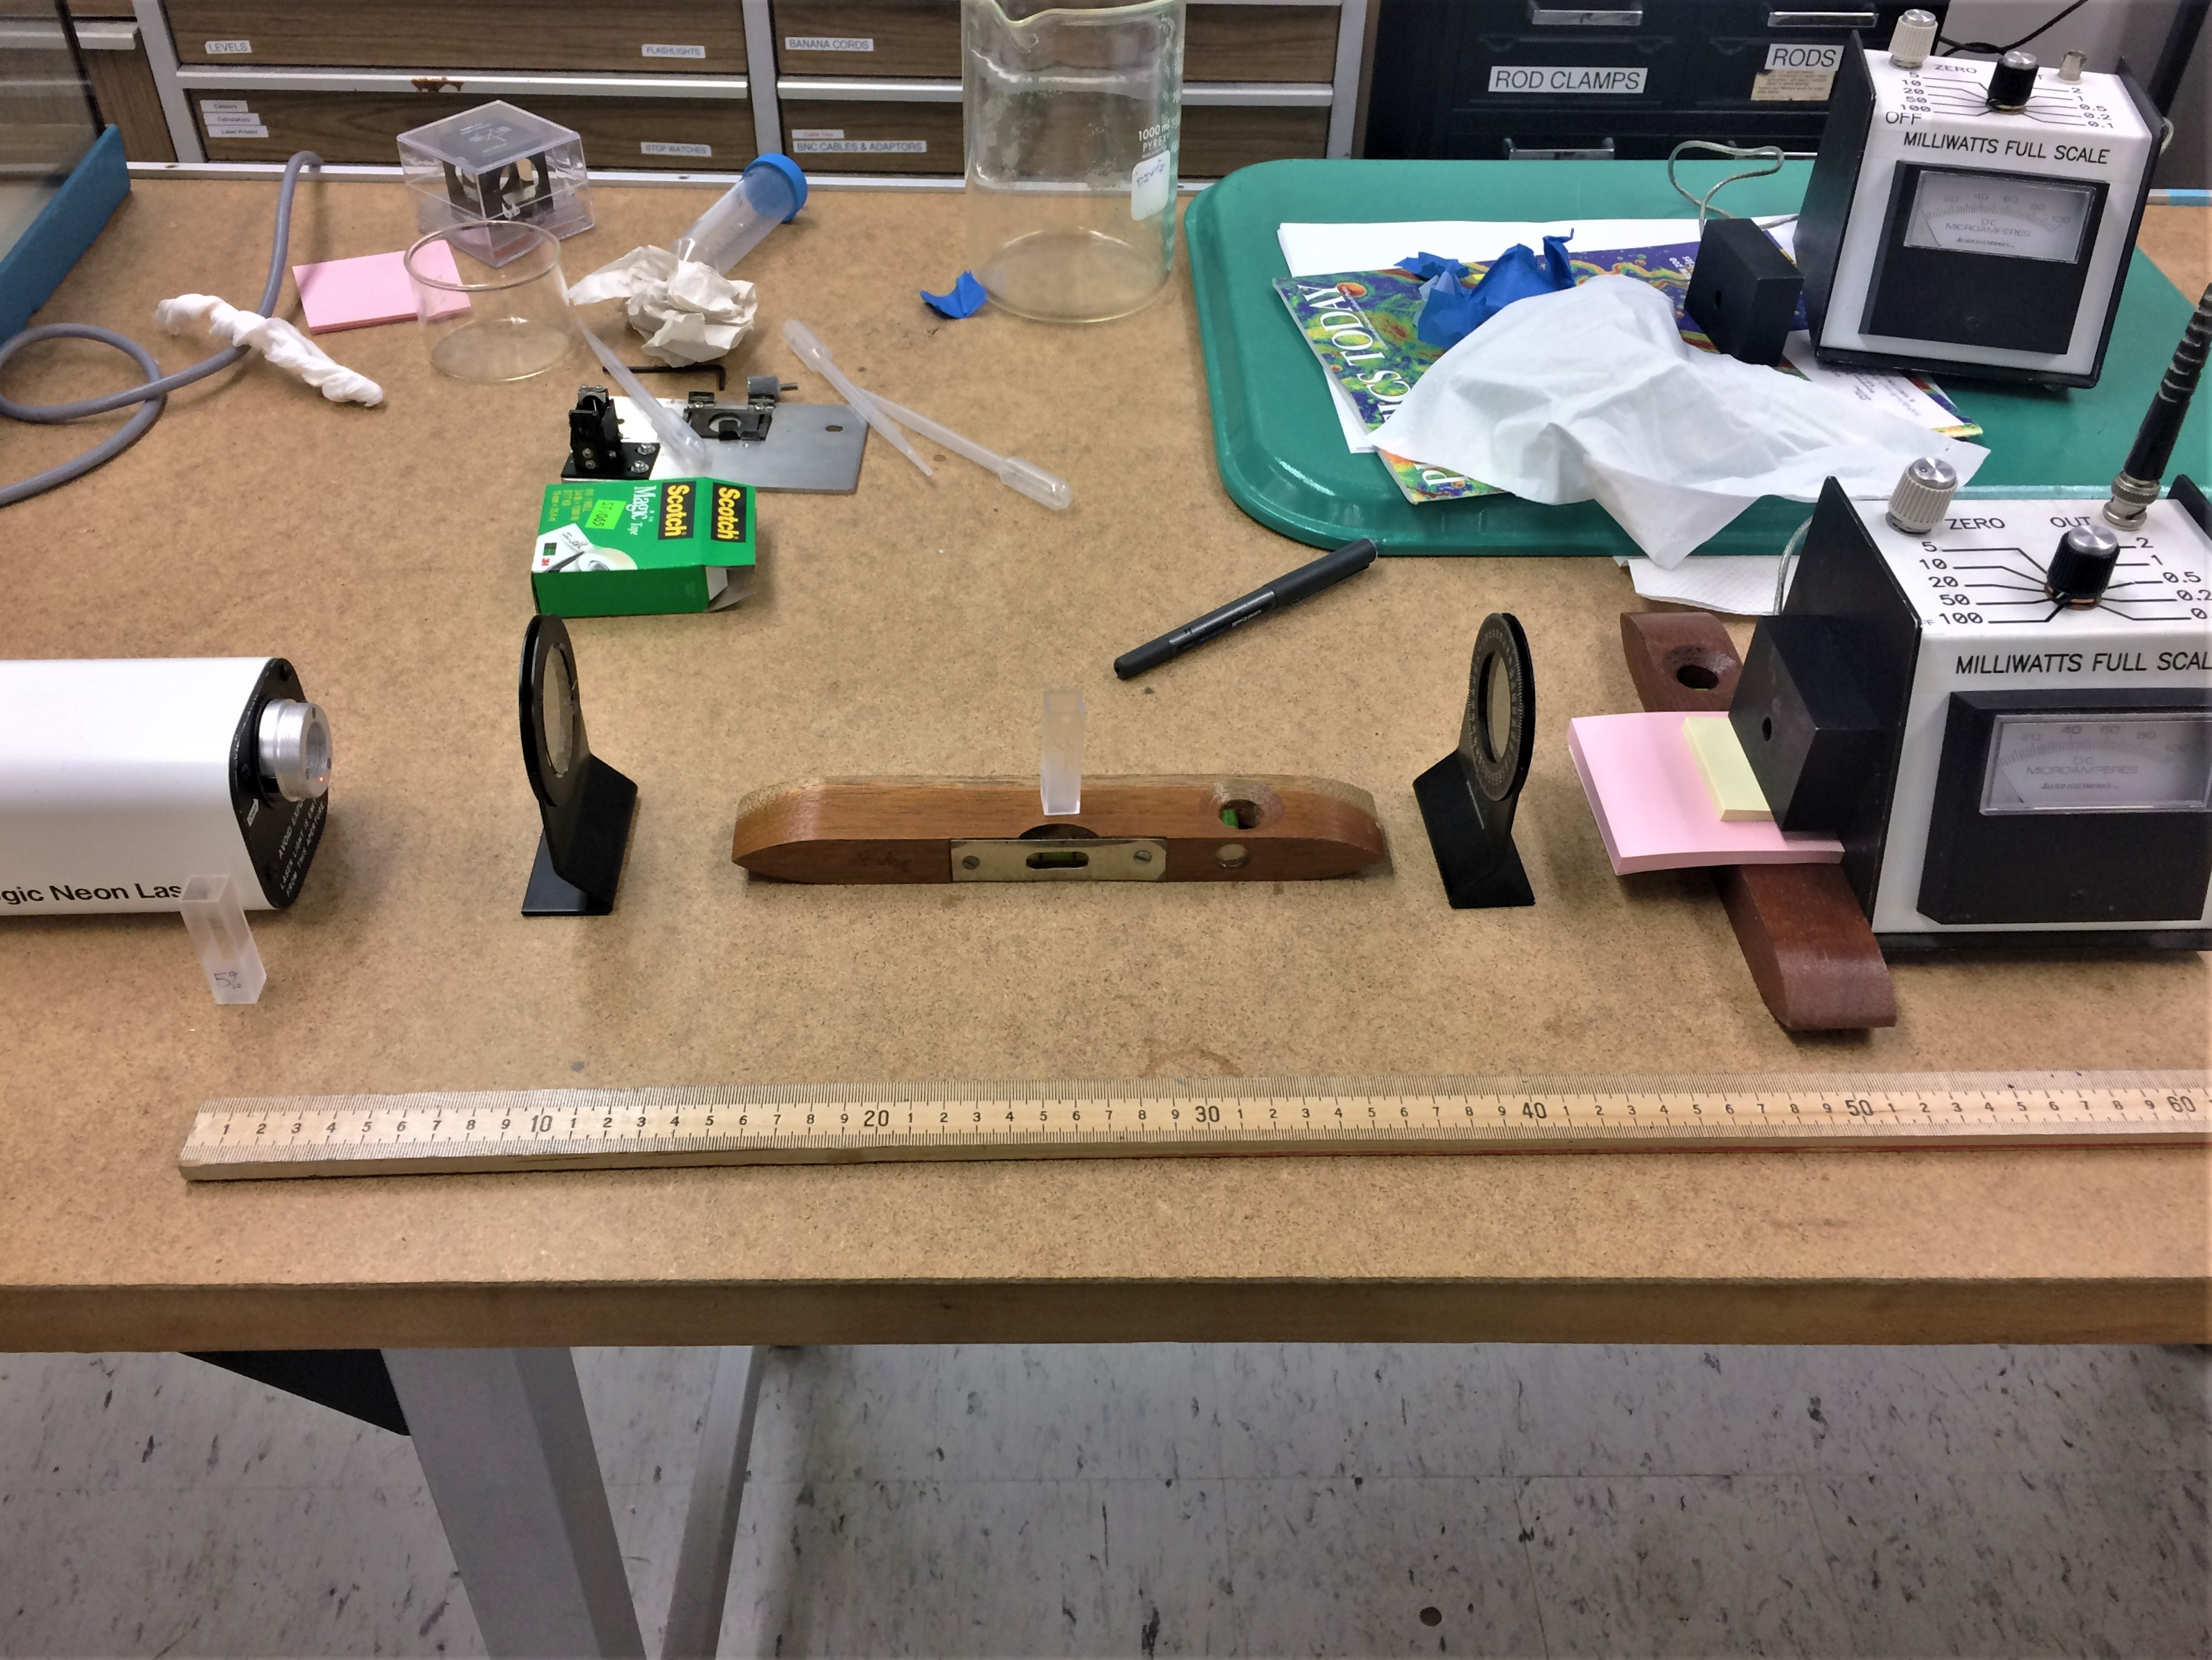 A photo of the experimental setup. The laser is located on the left, 50cm from the light detector on the right. The two polarizing filters are located 10cm from each end. The polarizer on the left is fixed at 0° while the one on the right is free to move as it rotates from 0° to 180° in 15° increments. The solution is placed directly in the center in a 4.5mL vial that measures 1cm across.
We measure emptied 6mL of our sugar, which was 99% sucrose, into a graduated cylinder and weighed that to determine the density of our sucrose, which was 0.853g/mL. While this is below the accepted value of 1.59g/mL* \cite{Chem}, we believe this was due to the packing inefficiency of our sugar grains. The reason for these extra steps was so we could create our various concentrations by measuring volume instead of mass, as we had more accuracy that way. Our volume measurements were accurate to within ± 0.057 mL. For each concentration we put 4.5 mL of our solution in a square vial 1± 0.057 cm across on the inside.
The laser, a 632.6nm Metrologic Instruments Inc. ML810 Neon Laser, was set up 50 cm ±0.057cm away from our light detector, an Allied Electronics Laser Light Detector. We placed out two rotating linear polarizing filters 10cm in from the ends, with the filter closest to the light source fixed at 0°. The vial with our solution was placed directly in the center of this, as seen in FIG. \ref{diag}.
The light detector had an analog reading and was plugged into a GW Instek GDM-8245 Digital Multimeter for a more accurate reading. Although the DMM is rated by the manufacturer at ±0.03% accuracy, we wanted to establish our own standard deviation that takes into account uncertainties in the laser intensity, light detector, and DMM. We took 20 different readings with the polarizers set to 0° offset in order to establish the deviation for our uncertainty at ±13.8103 µA.
During the experiment we took light level readings while slowly rotating the second polarizing filter through 180°. We took measurements every 15°, starting at 0°. We also took an additional measurement when the light detector hit its minimum value. For this we recorded both the reading of the minimum as well as the polarizer angle at which this occurred. The uncertainty for the current is mentioned above, while the measurement of the polarizer angle is certain to within ±1.15°.
Results
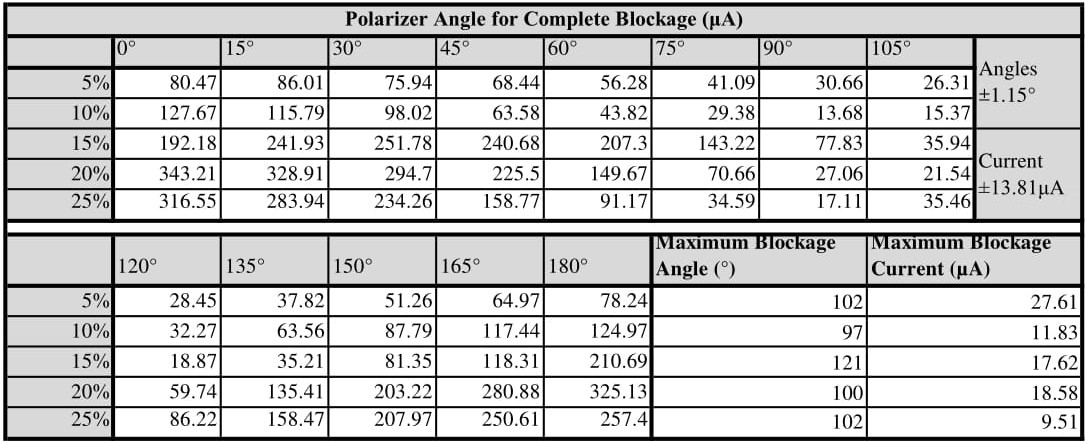 In addition to recording the light levels every 15°, we took recordings at the polarizers maximum blocking angle–the angle at which the minimum amount of light was reaching our light detector. Our standard deviation for the current readings was ±13.8103µA, while our uncertainty for the angular measurements was limited by the granularity of measurement at ±1.15°.
The raw data that resulted can be seen in the table in FIG. \ref{raw data}. The maximum blocking angle has been bolded for each concentration, as that is the key result from the data. This element of the data is what allows us to solve for the specific rotation using the Drude Model in equation \ref{Drude}. Before we do that, it is helpful to look at a plot of the raw data (FIG. \ref{raw plot}) to look at any trends in our data. First off we note that the 15% sucrose solution seems to be an outlier, with a blocking angle around 20° higher than the other concentrations. We also notice that there does not seem to be a linear readily evident, despite equation \ref{Fit} suggesting it.
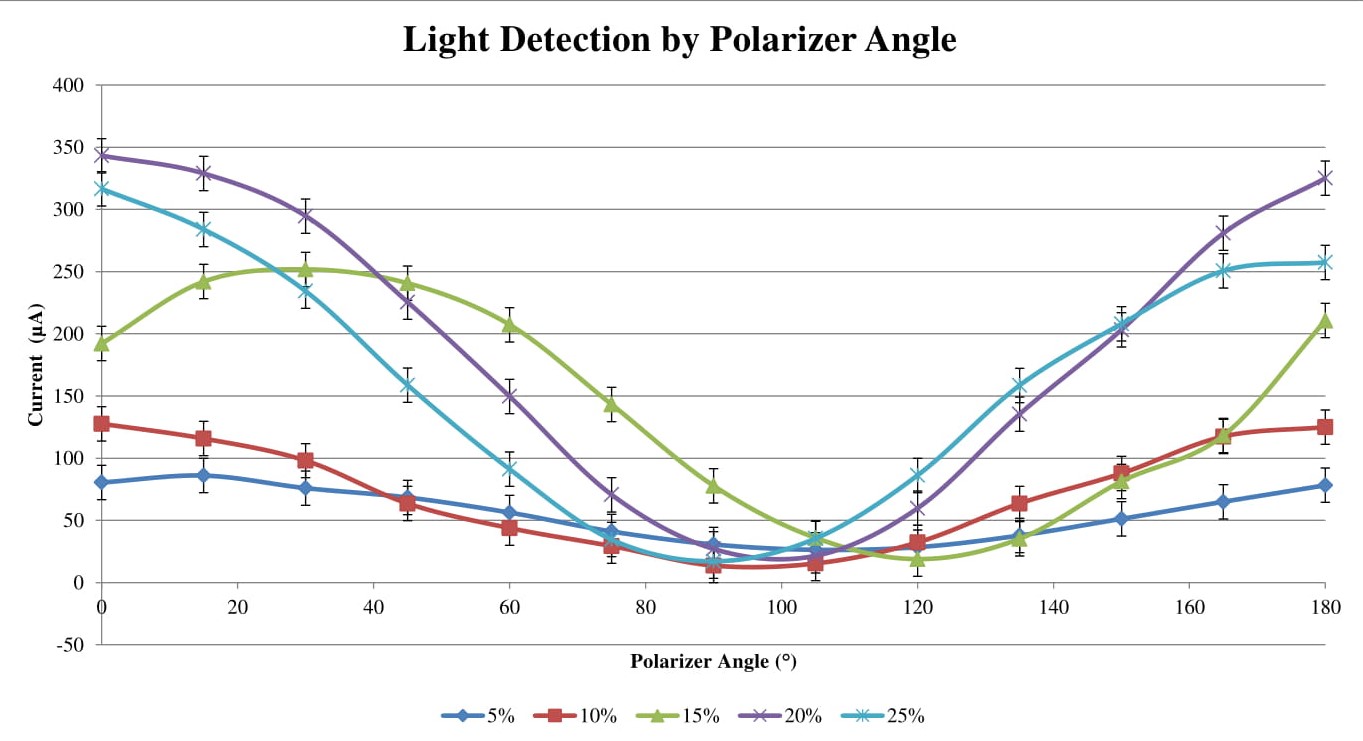 For each polarizer angle the resulting light level was recorded by measuring the current through a DMM attached to the light detector. The uncertainty indicated by the error bars is ±13.8103
In order to continue analyzing the data, we first have to convert the maximum blocking angle in FIG. \ref{raw data} to the optical rotation θ, which is 90° offset. This is because the two polarizers were set so that they perfectly blocked each other when the second polarizer was at 90°, which would correlate to an optical rotation of 0°.
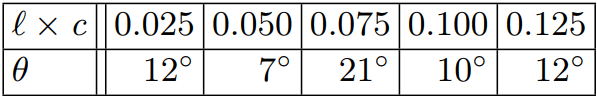 The new values for optical rotation. The values for have had 90° subtracted, while the values for are the previous values of concentration in times our value for the path length of 0.1cm
When we use the rearranged Drude equation (equation \ref{Fit}): to fit these values of to we get the resulting plot seen in FIG. \ref{drude plot}. From this plot we can extract the line of best fit, which is given by the equation
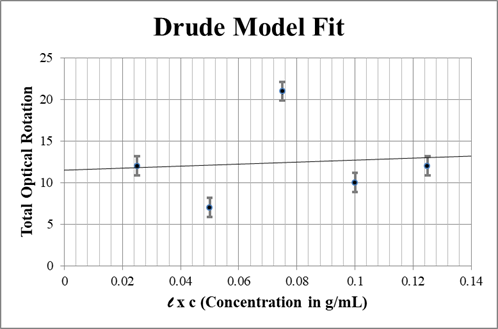 The linear fit for the Drude Model (equation \ref{Drude}). The error bars here represent the uncertainty in our angular measurements, ±1.15°. The final fit line is governed by equation \ref{final line}.
This leaves us with a final result for the specific rotation of sucrose, at room temperature with 632.6nm light, given by:
Unfortunately this number has a high uncertainty and does not match the values found in Patterson et. al. \cite{Patterson}. That team found a value for the specific rotation of sucrose of .
We believe that there were several sources of potential systematic error that contributed to this discrepancy. First and foremost, it has been stipulated that the vials themselves may have affected the polarization. While we took many trials with no vial to find a standard deviation, we never conducted a trial with just an empty vial to compare to. Secondly, at various point during experimentation the light detector would begin to fluctuate rapidly, and occasionaly it would begin to climb rapidly with no apparent reason. Whether this was an issue with the laser or the light detector is uncertain. When this happened, we would have to wait for the fluctuations to stop and repeat the trial. While we did the best we could to counteract this, it is possible that this still skewed the data. We also failed to apply a method that would ensure that our solution vial remained perpendicular to the laser beam. Had we set up a stand specifically to hold it in a specific position, we may have negated error due to any refraction.
Additionally, I believe this experiment could have been improved had we performed it with a larger vial for our solution. You can tell in equation \ref{Fit} that since the total optical rotation is proportional to , increasing the path length would have resulted in a larger optical rotation that may have been less susceptible to small errors.
In conclusion, our experiment yielded the specific rotation of sucrose, which we found to be . However this experiment experienced a number of systematic errors that caused our value to differ greatly from the values reported by others. In the future, better planning, more consistent equipment, and a larger path length may make this experiment return data more similar to accepted values.
References
-
Horvath, G., “Polarization Patterns In Nature: Imaging Polarimetry with Atmospheric Optical and Biological Applications.” D.Sc. dissertation, Lorand Eotvos University. (2003) https://arago.elte.hu/sites/default/files/DSc-Thesis-2003-GaborHorvath-01.pdf
-
Lowry, T.M.; Richards, E.M., “The rotatory dispersive power of organic compounds. Part XIII. The significance of simple rotatory dispersion. Rotatory dispersion of camphorquinone and of sucrose.” Journal of the Chemical Society, Transactions, 125(0); 2511-2524. (1924) 10.1039/ct9242502511
-
Mahurin, S.M.; Compton, R.N.; Zare, R.N., “Demonstration of Optical Rotatory Dispersion of Sucrose.” Journal of Chemical Education, 76(9); 1234-1236. (1999) 10.1021/ed076p1234
-
National Center for Biotechnology Information. PubChem Compound Database; CID=5988, https://pubchem.ncbi.nlm.nih.gov/compound/5988 (accessed June 9, 2018).
-
Patterson, L.H.C.; Kihlstrom, K.E.; Everest, M.A., “Balanced polarimeter: A cost-effective approach for measuring the polarization of light.” American Journal of Physics, 83(1); 91-94. (2015) 10.1119/1.4896747
-
Soetedjo, H.; Raty, J., “Use of a modified Drude’s equation to investigate the optical rotation property of sugars.” Optik - International Journal for Light and Electron Optics, 125(24); 7162-7165. (2014) 10.1016/j.ijleo.2014.07.112
-
Vogel, A.I., “Vogel’s textbook of practical organic chemistry.” (5th edition) Harlow, Longman. (1996) ISBN0582462363.